
Objectives
This chapter introduces various system model types used in requirements engineering and design. Upon completion, you will:
| Understand how graphical models represent software systems. | |
| Recognize different model perspectives (context, interaction, structure, behavior). | |
| Be familiar with UML diagram types and their use in system modeling. | |
| Gain awareness of model-driven engineering. |
System modeling creates abstract views of a system using graphical notations—primarily the Unified Modeling Language (UML)—to represent key perspectives such as structure, behavior, and interaction.
Models serve different purposes throughout development: during requirements engineering to understand current systems and propose new ones, during design to communicate system structure, and after implementation for documentation.
You may develop different models to represent the system from different perspectives. For example:
Model Perspectives
External – context or environment of the system.
Interaction – communication between system and environment.
Structural – organization and data structure.
Behavioral – dynamic responses and event handling.
This section explains that system architecture should be documented from multiple perspectives, aligning with Kruchten's 4 + 1 view model, which is covered in Chapter 6.
In this chapter, system modeling is done using the Unified Modeling Language (UML)—a standard for object-oriented modeling. UML includes many diagram types, but a 2007 survey found that five key types are most commonly used to capture a system's essentials:
Key UML Diagrams
| Diagram Type | Purpose |
|---|---|
| Activity Diagram | Process workflows |
| Use Case Diagram | System interactions |
| Sequence Diagram | Time-based interactions |
| Class Diagram | Object relationships |
| State Diagram | Event responses |
Purpose of Modeling
- Facilitate discussion about a system.
- Document existing structures and behaviors.
- Guide detailed implementation.
Informal models—common in agile development—prioritize understanding, while documentation models must be precise and correctly notated. In model-based development, precision is vital since models can directly generate source code, making accurate notation essential.
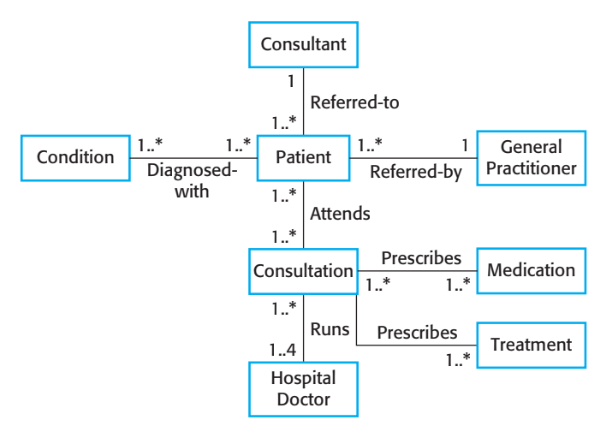
5.1 Context Models
Defining system boundaries is a crucial early step. It involves deciding which functionalities belong within the system and which remain external. Collaboration ensures clarity and avoids redundancy.
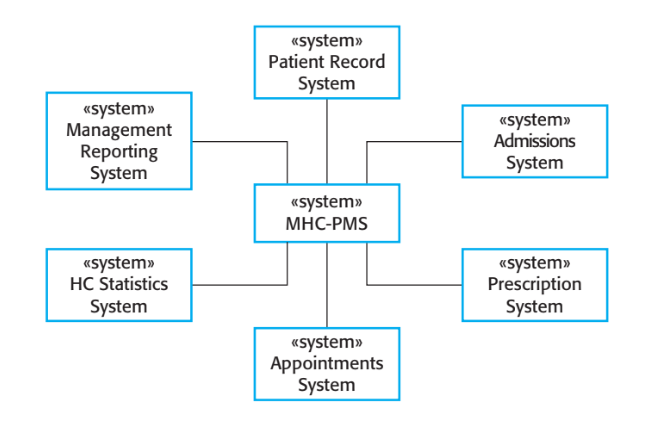
System boundaries are influenced by both technical and organizational constraints. Once defined, a context model visualizes the system’s interaction with external entities.
- Appointments System
- Patient Record System
- Management Reporting System
- Bed Allocation System
- Statistics System
- Prescription System
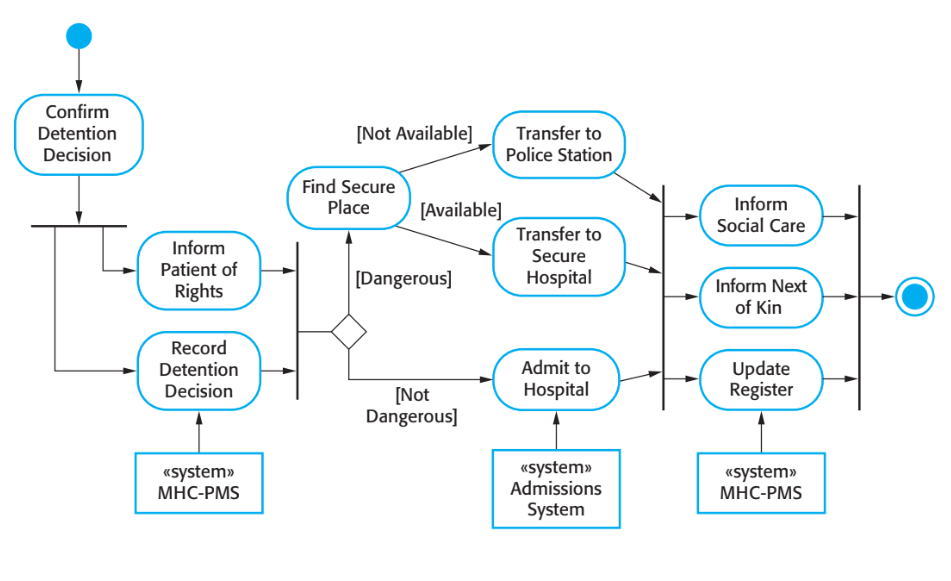
This activity diagram illustrates the MHC-PMS process for managing involuntary patient detention while ensuring legal compliance.
5.2 Interaction models
All systems involve some form of interaction—between users and the system, between the system and other systems, or among components within the system. Modeling these interactions is crucial: user interaction models help identify user requirements; system-to-system interaction models reveal potential communication issues; and component interaction models help assess whether the system's structure can meet performance and reliability goals.
Two key approaches to interaction modeling are:
| Use case modeling | Sequence diagrams |
|---|---|
| primarily captures interactions between the system and external actors, like users or other systems. | detail interactions between system components and may include external agents. |
Use case models provide a high-level overview, while sequence diagrams offer detailed views of interactions within those use cases. Although UML also supports communication diagrams for modeling interactions, they are essentially alternative views of sequence diagrams and thus are not discussed here. Some tools even generate communication diagrams automatically from sequence diagrams.
5.2.1 Use case modeling
Use case modeling, developed by Jacobson et al. in the 1990s and included in the first UML release, is widely used for requirements elicitation. A use case represents a simple scenario describing what a user expects from a system, focusing on a discrete task involving external interaction.
Graphically, a use case is depicted as an ellipse, with involved actors shown as stick figures. For example, Figure 5.3 illustrates a use case from the MHC-PMS where the system uploads data to a more general patient record system. This general system maintains summary patient data, while the MHC-PMS records detailed consultation data.
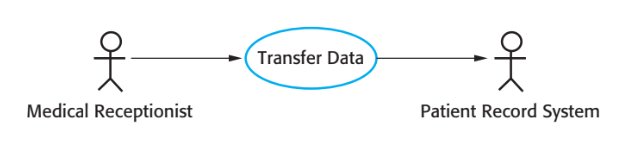
In the use case shown in Figure 5.3, there are two actors: the operator transferring the data and the patient record system. While stick figures were originally meant to represent humans, they are now also used to depict external systems or hardware.
Formally, use case diagrams use lines without arrows, since arrows in UML typically indicate message flow direction, but in use cases, messages flow both ways. However, in Figure 5.3, arrows are used informally to show that the medical receptionist initiates the transaction and data flows to the patient record system.
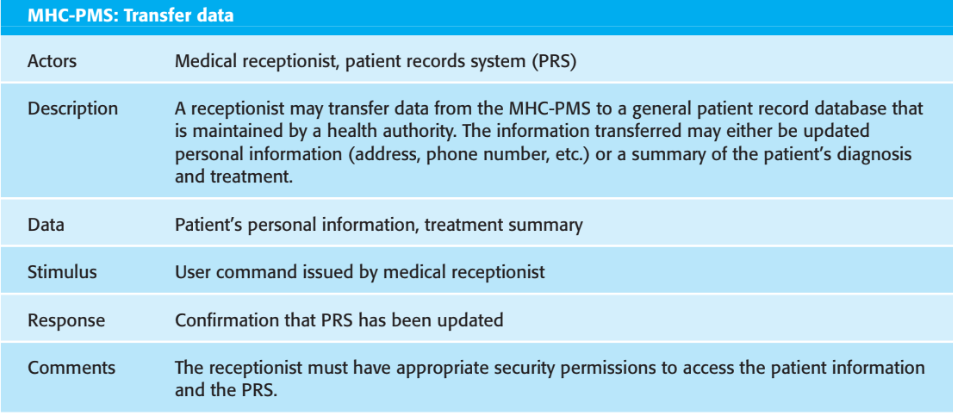
Use case diagrams provide a simple overview of interactions but lack detail. To better understand the use case, more detailed descriptions are needed, which can be in the form of textual explanations, structured tables, or sequence diagrams. The choice depends on the use case and the required detail level, with tabular descriptions often being the most practical. Figure 5.4 shows such a tabular description for the 'Transfer data' use case.
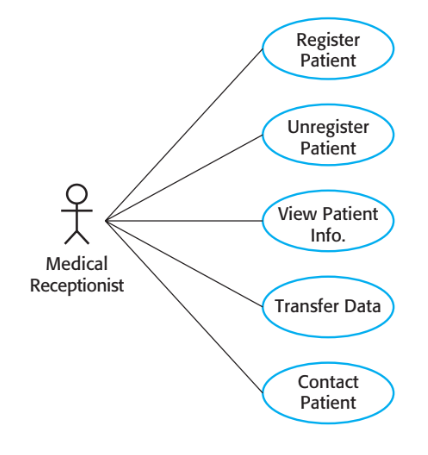
Composite use case diagrams combine multiple use cases into one view. Sometimes, all interactions with a system can be shown in a single composite diagram, but often this isn't feasible due to the sheer number of use cases. In those situations, you create several diagrams, each focusing on related use cases. For example, Figure 5.5 presents all the use cases involving the actor Medical Receptionist in the MHC-PMS, grouping relevant interactions for clarity.
5.2.2 Sequence diagrams
Sequence diagrams in UML are primarily used to model the order of interactions between actors and system objects, as well as inter-object communication. While UML offers a rich and detailed syntax for capturing various interaction types, this section focuses on the fundamentals.
As the name suggests, a sequence diagram represents the chronological flow of messages in a specific use case or scenario. For example, Figure 5.6 illustrates the interactions involved in the "View patient information" use case, where a medical receptionist accesses certain patient details. This diagram helps visualize how different parts of the system collaborate over time to fulfill that request.
In a UML sequence diagram, the actors and objects involved in the interaction are listed horizontally across the top. From each of these, a vertical dotted line (called a lifeline) extends downward, representing that entity's activity over time.
Interactions between these entities—such as method calls or messages—are shown as horizontal arrows, annotated with details like the method name, parameters, and return values. A rectangle on a lifeline indicates when the object is actively participating in the interaction (its "activation" period).
The sequence of events is read from top to bottom, showing the order in which actions occur.
Additionally, if there are alternative flows in the process, an "alt" box is used. Each alternative is labeled with a condition in square brackets, indicating under what circumstances each branch is executed.
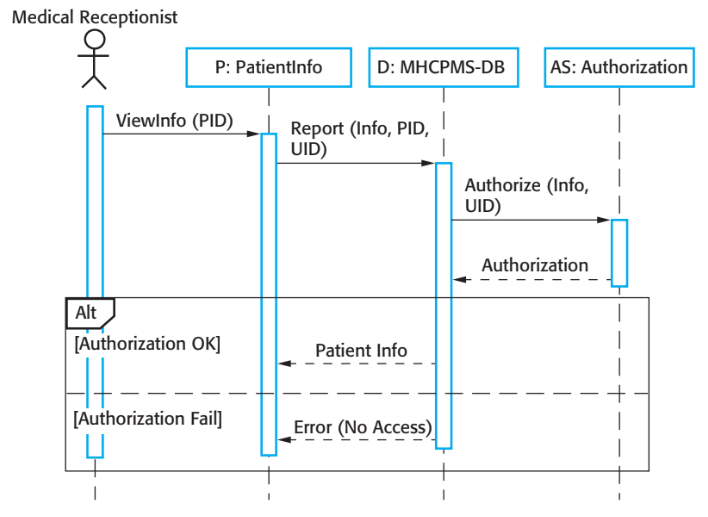
You can read Figure 5.6 as follows:
- In the sequence diagram (Figure 5.6), the medical receptionist initiates the interaction by calling the ViewInfo method on an instance P of the PatientInfo object class. The receptionist provides the patient's identifier (PID) as an input. The object P is a user interface element—specifically, a form that displays the patient's information on the screen.
- After receiving the patient ID, the instance P (the user interface object) makes a call to the database to retrieve the required patient information. It also sends the receptionist's identifier (UID) along with the request to enable security checking. At this point in the model, the source of the UID is not important—it is assumed to be available for authentication purposes.
- The database then contacts an authorization system to verify whether the user (medical receptionist) is authorized to access the requested patient information. This security check ensures that only users with the appropriate permissions can perform this action.
- If the authorization is successful, the patient information is retrieved from the database and used to populate the form on the medical receptionist's screen. However, if the authorization fails, the system returns an error message instead of the data, indicating that access is denied.
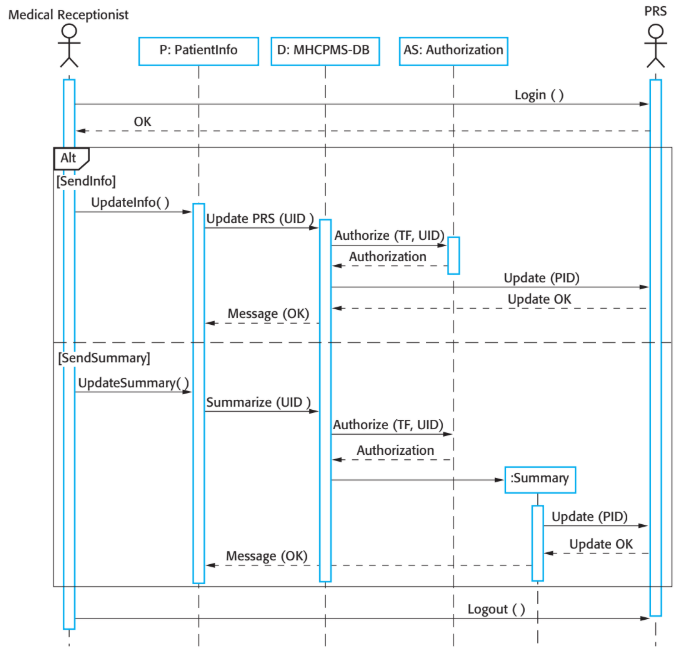
Figure 5.7 illustrates a sequence diagram from the MHC-PMS that introduces two new modeling features:
Direct
actor-to-actor communication, and
Dynamic
object creation during an operation sequence.
The flow of the diagram can be understood as follows:
- The medical receptionist logs in to the Patient Record System (PRS).
- Two transfer options are available:
- Direct transfer of updated patient information.
- Transfer of summary health data from the MHC-PMS to the PRS.
- In both cases, the authorization system is used to verify the receptionist's access permissions.
- Depending on the selected action:
- Personal information may be transferred directly from the user interface to the PRS, or
- A Summary object is created from the database, and that summary is uploaded to the PRS.
- Once the transfer is complete, the PRS sends a status message, and the receptionist logs off.
This diagram shows how system interactions can involve both direct communication and runtime object creation, adding depth to the modeling of system behavior.
This point emphasizes the level of detail needed in sequence diagrams based on their purpose. If you're using sequence diagrams during early phases of system development, such as for requirements engineering or high-level design, you don't need to include every interaction, especially those that depend on later implementation choices.
For instance, in Figure 5.7, the method for obtaining the user identifier to check authorization can be delayed until the implementation phase. While the User object might be involved in the final system, this detail is unnecessary at the early design stage. By leaving out such specifics, the diagram stays focused on core system behavior without getting bogged down in decisions that are yet to be made.
Thus, sequence diagrams at this stage should prioritize key interactions and general workflows, while more detailed interactions can be added later when the design and implementation choices are clearer.
5.3 Structural models
Structural models represent a system's components and their relationships. These can be static models (showing the system's design) or dynamic models (showing how the system behaves during execution). While static models focus on system architecture, dynamic models illustrate its runtime behavior.
In architectural design, UML component, package, and deployment diagrams are commonly used. This section specifically focuses on class diagrams to model the static structure of an object-oriented system.
5.3.1 Class diagrams
Class diagrams are used in object-oriented systems to represent the classes and their associations. A class defines a type of object in the system, while an association indicates a relationship between classes. Initially, classes represent real-world entities (like patients or prescriptions), but as development progresses, additional implementation objects are added for system functionality.
Class diagrams in UML can vary in detail. Early models focus on identifying essential real-world objects and their relationships. A simple class diagram, for example, may just show class names and associations, like the Patient and Patient Record classes with a connecting line to indicate their relationship.
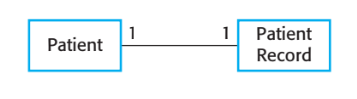
In Figure 5.8, class diagrams can also indicate the multiplicity of associations. In this case, the 1:1 relationship means that each Patient has one Patient Record, and vice versa. Other types of multiplicities are also possible, such as specifying a many-to-many relationship with a * (wildcard), indicating an indefinite number of associated objects.
In Figure 5.9, the diagram extends to show that Patients are linked to multiple other classes, and associations can be named to clarify the nature of the relationship. Additionally, the role of each object in the relationship can be specified, providing more context to the interaction between classes.
At this level, class diagrams resemble semantic data models, which are typically used in database design to represent data entities, their attributes, and relationships between them. The concept was introduced in the 1970s by Chen and further developed by Codd and others.
While UML doesn't have a specific notation for semantic data modeling (since it focuses on object-oriented design), you can still represent a semantic model using object classes (representing entities), attributes (as class attributes), and associations (as relationships between classes). Essentially, semantic data models can be seen as a simpler form of object classes, lacking operations but focusing on data structure.
To add detail to a class diagram, you can extend the simple class rectangle by including attributes and operations.
| Attributes define the characteristics of an object (e.g., a Patient object might have an Address attribute). |
| Operations represent actions or methods that can be performed on the object (e.g., a ChangeAddress operation that updates a patient's address when they move). |
These are added inside the class rectangle, typically with attributes listed in the top section and operations in the bottom section, creating a more detailed representation of the class.
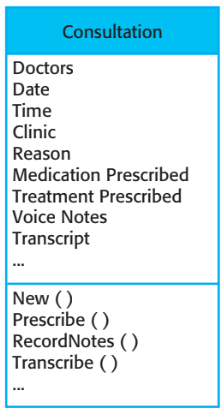
This is illustrated in Figure 5.10 where:
- The name of the object class is in the top section.
- The class attributes are in the middle section. This must include the attribute names and, optionally, their types.
- The operations (called methods in Java and other OO programming languages) associated with the object class are in the lower section of the rectangle.
Figure 5.10 outlines the Consultation class, which includes both attributes and operations. The attributes capture key details of the consultation, such as Date, Duration, and PatientID to identify the patient involved. The operations include RecordVoiceNote, where doctors can record audio notes during the consultation, which are later transcribed, and GeneratePrescription, which allows the doctor to create an electronic prescription for medication. This model illustrates the key processes involved in handling consultations and prescriptions within the system.
5.3.2 Generalization
Generalization is a technique used to simplify complex systems by grouping entities into broader categories. Instead of focusing on the specific characteristics of each individual entity, we classify them into more general types (such as animals, cars, or houses). This approach enables us to identify common traits shared by all members of a class. For instance, squirrels and rats are both rodents, so we can generalize that all rodents have teeth for gnawing. This method helps reduce complexity and makes it easier to apply general rules or statements across similar entities.

In system modeling, generalization helps to consolidate common attributes and behaviors into a single class, reducing redundancy and simplifying maintenance. By grouping related classes under a more general parent class, changes to common properties only need to be made in one place. This practice enhances efficiency, as modifications are automatically inherited by all subclasses. In object-oriented languages like Java, generalization is achieved through class inheritance.
The UML uses a specific notation for generalization, represented by an arrow with a hollow triangle pointing towards the parent class. For example, in a medical system, "General Practitioner" and "Hospital Doctor" can be generalized as "Doctor." Furthermore, the "Hospital Doctor" class can be further specialized into subclasses such as "Trainee Doctor," "Registered Doctor," and "Consultant," each with distinct responsibilities and levels of expertise.
In a generalization hierarchy, lower-level (subclass) classes inherit the attributes and operations of their higher-level (superclass) classes. This inheritance means that subclasses automatically have all the attributes and operations defined in the superclass, but they can also introduce more specific attributes and operations that are unique to them. For example, all doctors (the superclass) will have common attributes like "name" and "phone number," but hospital doctors (a subclass) will also have attributes like "staff number" and "department," which general practitioners (another subclass) do not need. Instead, general practitioners may have attributes like "practice name" and "address," as they work independently. In Figure 5.12, this generalization hierarchy is shown, where the class "Doctor" has operations for registering and de-registering doctors within the MHC-PMS system. Subclasses like "Hospital Doctor" and "General Practitioner" can extend or modify this base functionality to suit their specific needs.

5.3.3 Aggregation
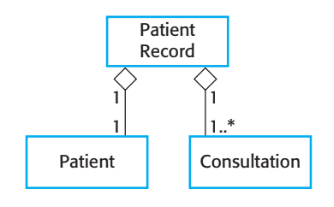
In system modeling, aggregation is used to represent the relationship where one object (the whole) is composed of other objects (the parts). For example, a study pack may consist of a book, PowerPoint slides, quizzes, and reading recommendations. In UML, aggregation is depicted using a diamond shape next to the class that represents the whole object. For instance, in Figure 5.13, a "Patient Record" is shown as an aggregation of "Patient" and an indefinite number of "Consultations," indicating that the patient record is composed of these components. This illustrates how objects can be structured from other, smaller objects.
5.4 Behavioral models
Behavioral models represent the dynamic aspects of a system during its execution, showing how the system responds to stimuli from its environment. These stimuli can be of two types:
| Data | Events |
|---|---|
| This refers to incoming data that the system needs to process. | These are actions or occurrences that trigger specific system processes. Events may or may not be associated with data. |
Behavioral models help illustrate how the system behaves over time in response to these inputs.
Business systems often fall into two categories based on how they are driven:
- Data-Driven Systems: These systems are primarily controlled by the data they receive. Their processing involves actions on this data and the generation of outputs. For example, a phone billing system processes data about customer calls, calculates costs, and generates a bill.
- Event-Driven Systems: These systems are triggered by specific events rather than data. They perform minimal data processing. A real-time system like a landline phone switching system responds to events such as a "receiver off hook" to generate a dial tone, or key presses to capture a phone number.
5.4.1 Data-driven modeling
Data-driven models illustrate the sequence of actions involved in processing input data and generating output. They are especially useful during requirements analysis, as they show the end-to-end processing of data—how it moves through the system from input to output.
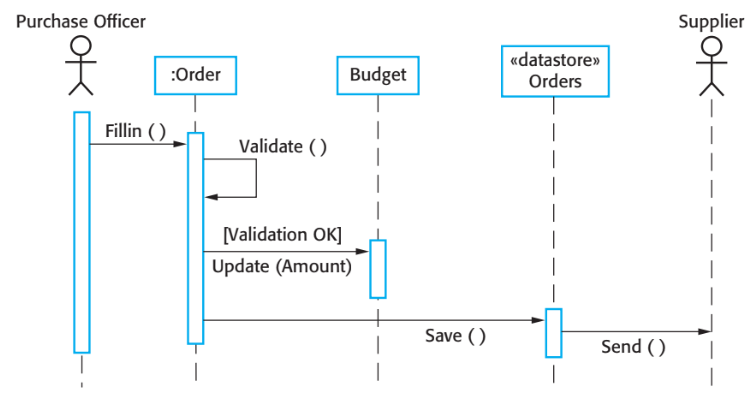
In the 1970s, methods like DeMarco's Structured Analysis introduced Data Flow Diagrams (DFDs) to model data processing. These models helped analysts and designers understand the movement of data through a system and were simple and intuitive for explaining system processes to users.
Although UML does not support traditional DFDs, it introduced activity diagrams in UML 2.0, which are similar in purpose. These diagrams show the processing steps (activities) and the flow of data (represented as objects). For example, an insulin pump software model can use activity diagrams to depict the processing sequence and data interactions, much like data-flow diagrams did.
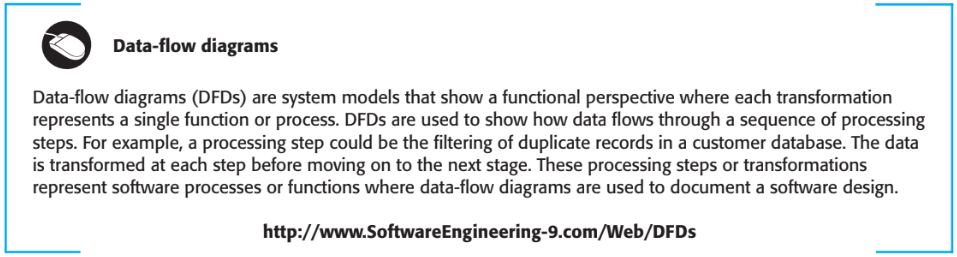
An alternative to using data-driven models for depicting sequence processing is through UML sequence diagrams. While sequence diagrams are typically used to model interactions, they can also represent sequential data processing by showing messages that flow from left to right. For example, in Figure 5.15, a sequence diagram models the processing of an order and sending it to a supplier.
Unlike data-flow diagrams, which emphasize system functions, sequence diagrams focus on the objects involved in the system. This makes sequence diagrams useful for illustrating how objects interact and how data is processed in a sequential manner. The equivalent data-flow diagram for the same order processing system can be found on the book's web pages for comparison.
5.4.2 Event-driven modeling
Event-driven modeling focuses on how a system responds to external and internal events. It operates on the premise that a system has a finite number of states, and that events or stimuli trigger transitions between these states. For instance, in a system controlling a valve, an event such as an operator command may cause the system to transition from the state "Valve open" to "Valve closed." This approach is particularly useful for real-time systems, where the system must respond to events as they occur. Event-based modeling was first introduced in real-time design methods by Ward and Mellor (1985) and Harel (1987, 1988).
The UML supports event-based modeling through state diagrams, which are based on Statecharts (Harel, 1987, 1988). These diagrams represent the different system states and the events that trigger transitions from one state to another. While state diagrams don't display data flow within the system, they can include information about the computations that occur within each state.
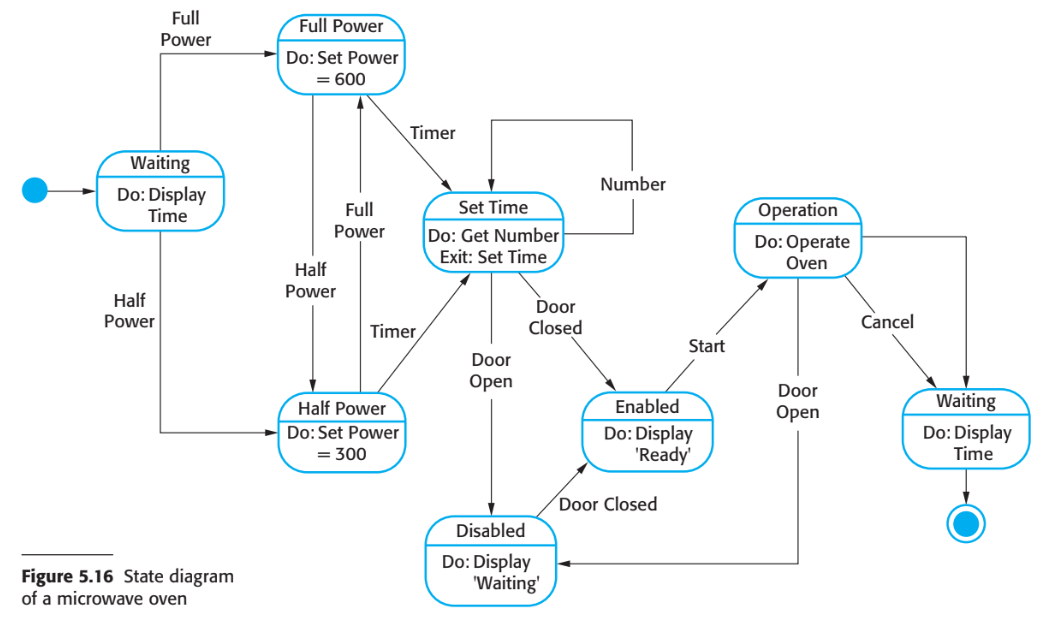
To illustrate event-driven modeling, a simple example of microwave control software is used. While real microwave ovens are far more complex, this simplified version is easier to understand. The basic microwave system includes a power switch (for full or half power), a numeric keypad to input cooking time, a start/stop button, and an alphanumeric display. This system's behavior can be modeled using a state diagram to capture the transitions between states, such as "Waiting for input," "Cooking," and "Paused."
I have assumed that the sequence of actions in using the microwave is:
- Select the power level (either half power or full power).
- Input the cooking time using a numeric keypad.
- Press Start and the food is cooked for the given time.
In a UML state diagram, system states are represented by rounded rectangles, each of which can include a brief description of the actions that occur in that state, often following a "do" keyword. Labeled arrows indicate the events or stimuli that trigger transitions from one state to another. The start and end states can be shown using filled circles, similar to the notation in activity diagrams.
For the microwave example, the state diagram would include states like "Waiting for Input," "Cooking," and "Paused." Safety checks such as ensuring the door is closed before cooking starts could be modeled as conditions or guards on the transitions. When cooking is complete, an event (like the cooking timer finishing) would trigger the "Completion" state, where the buzzer sounds as an alert. The alphanumeric display can show various warnings, like "Door Open" or "Cooking Complete," depending on the current state.
In Figure 5.16, the state diagram begins with the system in a "Waiting" state, where it awaits user input. The system responds to either the full-power or half-power button being pressed, which allows the user to select the desired power level. If the user changes their mind, they can press the other button to switch the power level.
Once the time is set and if the door is closed, the Start button becomes enabled. Pressing the Start button transitions the system into the "Cooking" state. During the cooking process, the microwave operates for the specified duration. After the cooking cycle ends, the system returns to the "Waiting" state, ready for the next user interaction.
This flow clearly defines the user interactions and system responses, and can be represented as transitions in a UML state diagram, with each state and event triggering specific actions or conditions.
The UML notation allows for the inclusion of detailed activities within each state. For example, Figure 5.17 provides a tabular description of each state, specifying the stimuli that trigger state transitions. This level of detail is important in system specification, where understanding the exact conditions for state changes is crucial.
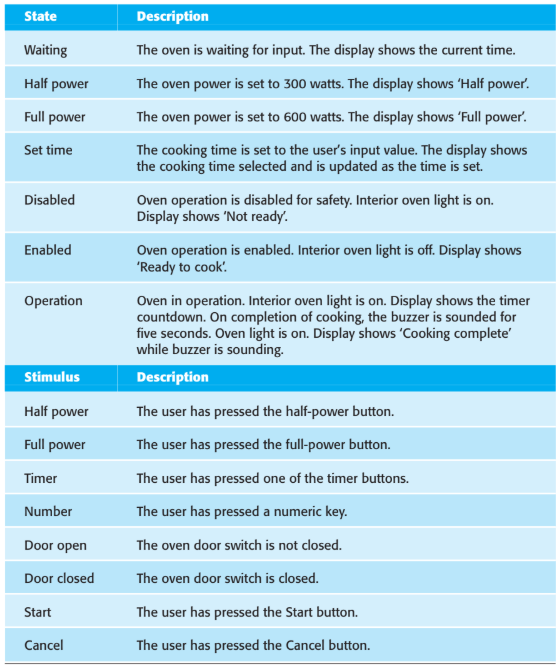
However, state-based modeling can become cumbersome as the number of states in the system grows, especially for larger systems. To manage this complexity, you can use the concept of superstates, which group multiple related states under a single higher-level state. This approach allows you to hide complexity in the high-level model and expand it when needed for greater detail.
For instance, in Figure 5.18, the Operation state is a superstate. This superstate is expanded to reveal its substates, which include:
| Status check: The system checks for any problems. |
| Alarm: If any issues are found, an alarm is triggered and the system enters a disabled state. |
| Cooking: The microwave runs for the specified time. |
| Buzzer: After cooking, a buzzer sounds to indicate completion. |
| Door open: If the door is opened during operation, the system enters the disabled state, as shown in Figure 5.15. |
This hierarchical approach helps manage the complexity by abstracting lower-level states into more manageable superstates, while still allowing for detailed breakdowns when needed.
5.5 Model-driven engineering
Model-driven engineering (MDE) is a software development approach where the primary outputs are models rather than traditional code. The models serve as high-level representations of the system, and the actual program code is automatically generated from these models.
The key idea behind MDE is that it raises the level of abstraction in the development process. Engineers focus on creating models that describe the system's behavior, structure, and functionality, without having to worry about low-level details such as programming languages or platform-specific execution concerns. This can potentially lead to faster development cycles, improved consistency, and easier maintenance by automating code generation directly from the models.
Model-Driven Engineering (MDE) has its origins in Model-Driven Architecture (MDA), which was introduced by the Object Management Group (OMG) in 2001 as a new approach to software development. While MDE and MDA are often used interchangeably, MDE is broader in scope.
MDA mainly focuses on the design and implementation phases of software development, providing models that can be automatically transformed into executable code. However, MDE goes beyond just design and implementation, addressing all aspects of the software engineering process, from requirements engineering to testing.
In summary, while MDA is centered on design and implementation, MDE includes areas like model-based requirements engineering, model-driven software processes, and model-based testing, making it a more comprehensive approach to software development.
Model-Driven Engineering (MDE) offers both advantages and challenges, and its adoption in software engineering is still evolving. Here are the main arguments for and against MDE:
| For MDE: | Against MDE: |
|---|---|
| High-Level Abstraction: MDE enables engineers to focus on designing systems at a high level, abstracting away the complexities of implementation. This reduces the likelihood of errors, speeds up the development process, and facilitates the creation of reusable, platform-independent models. | Platform Independence: MDE allows system implementations to be generated for different platforms using the same model. By creating a translator for a new platform, all existing platform-independent models can be quickly adapted, making it easier to rehost systems on new technologies. |
| Wrong Abstractions for Implementation: While models are useful for facilitating design discussions, the abstractions in these models may not always match the realities of the implementation. For example, an informal design model may not be easily translated into a working system, especially if off-the-shelf configurable packages are used for implementation. | Limited Relevance to Shorter Lifespan Systems: The advantages of platform independence are most relevant for large, long-lifetime systems where platforms may become obsolete. For these systems, issues like requirements engineering, security, dependability, integration with legacy systems, and testing are often more critical than platform reusability. |
In summary, while MDE holds promise for simplifying software development through abstraction and platform independence, its practical impact may be limited for certain types of systems, especially where other engineering challenges outweigh platform adaptation concerns.
Model-Driven Engineering (MDE) has seen some significant successes, particularly in large organizations like IBM and Siemens, and in complex, long-lifetime systems like air traffic management. The Object Management Group (OMG) has reported these successes on their website, showcasing MDE's potential for large-scale, mission-critical applications.
However, despite these successes, MDE has not yet achieved widespread adoption in the software engineering industry. Similar to formal methods, which are discussed in Chapter 12, MDE is considered a promising approach but is not universally accepted or implemented. The challenge remains in balancing the costs and risks of using MDE with its potential benefits. While MDE can offer significant advantages, particularly in terms of high-level abstraction and platform independence, its practical application on a broad scale still faces hurdles that need to be overcome.
5.5.1 Model-driven architecture
Model-Driven Architecture (MDA) is a software design and implementation approach that focuses on using models to describe a system at various levels of abstraction. MDA leverages a subset of UML models to represent the system's design. The core idea is to start with a platform-independent model (PIM), which describes the system's functionality without being tied to any specific technology or platform.
From this high-level model, it is theoretically possible to automatically generate a working program with minimal or no manual intervention. The aim is to abstract away platform-specific details during the design phase, allowing for more flexible and adaptable systems. By creating models at different abstraction levels, MDA facilitates easier adaptation and reconfiguration for different platforms and technologies.
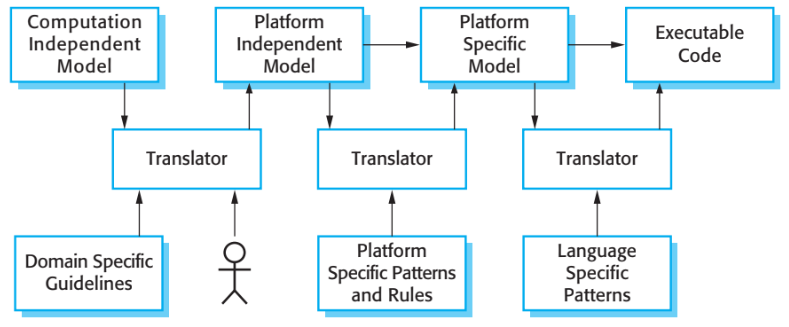
The Model-Driven Architecture (MDA) method recommends producing three types of system models to guide the design and implementation process:
| Computation Independent Model (CIM): | This model focuses on the essential abstractions of the system's domain, independent of any computational or technical details. It captures key concepts and their relationships within the system, often resulting in multiple CIMs that represent different perspectives (e.g., a security model or a patient record model). CIMs define important domain concepts such as assets, roles, or entities like patients and consultations. |
| Platform Independent Model (PIM): | The PIM describes the system's operation and functionality without specifying platform-related implementation details. It focuses on the static structure of the system (such as class diagrams) and its response to external and internal events. PIMs are typically represented using UML models and can be adapted to different platforms. |
| Platform Specific Models (PSM): | These models are derived from the PIM and incorporate platform-specific details. Each PSM corresponds to a different application platform (e.g., middleware, databases) and adds the required technical specifications. Multiple layers of PSMs can be created, with each layer introducing additional platform-specific details as needed (e.g., starting with middleware-specific models, then refining for a specific database). |
Together, these models help abstract the system's design and facilitate automatic transformation into working code across different platforms.

Transformations between models can be automated, such as converting a PSM into executable code. However, fully automatic CIM-to-PIM translation is still experimental and requires human input. This often involves linking concepts across CIMs (e.g., mapping a "role" in a security CIM to a "staff member" in a hospital CIM). Mellor and Balcer (2002) call these mappings "bridges."
The translation of Platform-Independent Models (PIMs) to Platform-Specific Models (PSMs) is a more advanced and well-established process, supported by a range of commercial tools. These tools utilize comprehensive libraries of platform-specific rules and design patterns to automatically convert a PIM into the corresponding PSM. Furthermore, a single PIM may be used to generate multiple PSMs, enabling software systems to be deployed across different platforms such as J2EE and .NET without duplicating development effort. In such cases, only the PIM requires ongoing maintenance, while the PSMs for each designated platform can be generated automatically, thereby enhancing efficiency and consistency in system implementation.
Although Model-Driven Architecture (MDA) tools provide platform-specific translators, these typically offer only partial support for translating Platform-Independent Models (PIMs) into Platform-Specific Models (PSMs). This limitation arises because a system's execution environment extends beyond standard platforms such as J2EE or .NET, encompassing additional elements such as company-specific application systems, proprietary libraries, and user interface components. Since these aspects differ widely across organizations, standardized tool support is often inadequate. Consequently, the introduction of MDA may require the development of special-purpose translators tailored to the local environment. In certain cases, such as user interface generation, fully automated translation from PIM to PSM may not be feasible.
There exists a fundamental tension between agile methods and model-driven architecture (MDA), as the emphasis on extensive up-front modeling conflicts with the principles outlined in the Agile Manifesto. Many agile developers are therefore skeptical of model-driven engineering. Proponents of MDA, however, argue that it can be applied in an iterative manner, aligning it with agile practices (Mellor et al., 2004). In theory, if transformations were fully automated and complete programs could be generated directly from Platform-Independent Models (PIMs), MDA could integrate seamlessly into agile development by eliminating the need for manual coding. In practice, however, current MDA tools lack support for essential agile practices such as regression testing and test-driven development, limiting their compatibility with agile processes.
5.5.2 Executable UML
The central concept of model-driven engineering is the possibility of fully automating the transformation of models into executable code. Achieving this requires the development of graphical models with precisely defined semantics, along with mechanisms for specifying how the operations described in the model are to be implemented. This capability is provided by Executable UML (xUML), a specialized subset of UML 2 (Mellor and Balcer, 2002). While the detailed workings of xUML are beyond the current scope, its main features can be briefly outlined to highlight its role in supporting model execution.
UML was originally intended as a language for software design and documentation rather than as a programming language. Its focus was on expressiveness rather than precise semantics, introducing concepts such as use case diagrams, which are valuable for design but too informal for execution. To enable execution, UML has been refined into a smaller, more rigorous subset. In this executable subset, the number of model types is reduced to three key types:
- Domain models, which define the main concerns of the system using UML class diagrams that capture objects, attributes, and associations.
- Class models, which specify classes together with their attributes and operations.
- State models, which attach a state diagram to each class to represent its lifecycle.
The dynamic behavior of a system can be defined in two ways: declaratively, using the Object Constraint Language (OCL), or procedurally, through UML's action language. The action language functions as a high-level programming language, allowing developers to reference objects and their attributes while specifying the actions to be executed. This provides a precise means of modeling system behavior in executable terms.